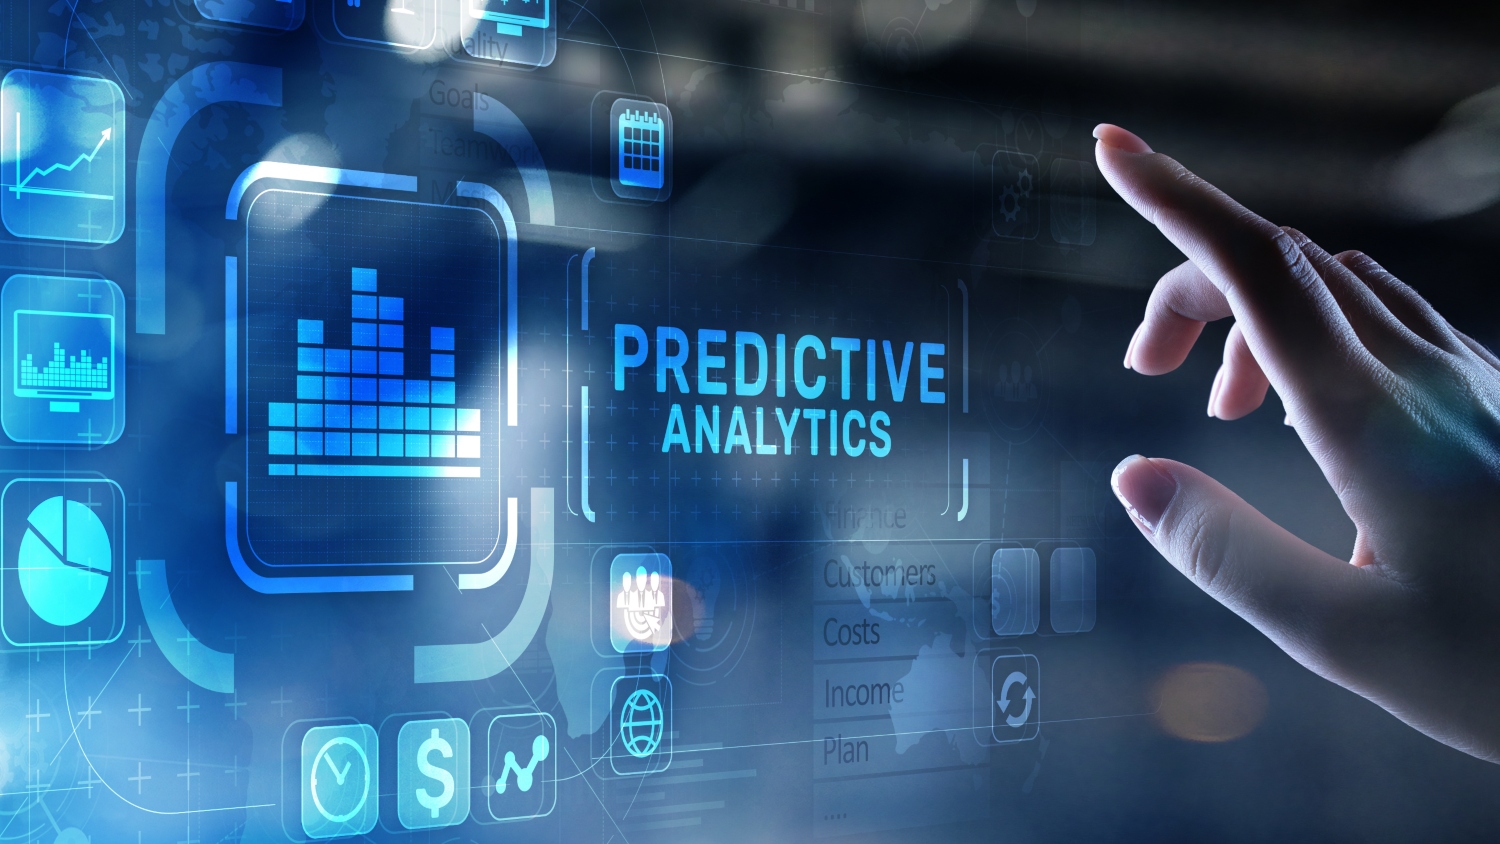
Basiru Usman Discusses Predictive Analytics and the Future of Marketing
By Samantha Beavers
How can predictive analytics models help organizations understand consumer decision-making? What value do neural networks bring to the field of marketing? And what should aspiring marketing analysts keep in mind?
To discuss these key issues and more related to the future of marketing, Poole College of Management hosted the third installment of its virtual Speaker Series on Oct. 20 with Basiru Usman, Poole College teaching assistant professor in the department of business management. Moderated by Master of Management, Marketing Analytics graduate student Emily Gower, the discussion highlighted the importance and versatility of predictive analytics tools, as well as the growing importance of marketing analytics skills in today’s business environment. Here are some of the highlights.
*Note: Some of the responses have been edited for brevity and clarity. For the full conversation, please watch the video below.
What are some of the current topics researchers are addressing in the realm of marketing analytics?
Analytics is almost everywhere now, so there are a large number of topics – but I’ll try to summarize a few of them. One is recommendation filtering. When we open our browser and search for something, sometimes we’ll see an advert saying ‘Do you want to buy this?’ or ‘Something’s coming out’ or ‘A new computer has been launched’ or something like that. The question is: how do they know that I need a computer, not a car? This type of personalized marketing is really, really important for marketers and it’s what we call recommendation filtering. You can either do this between individuals or between products. If I purchase something that looks similar to another product (that I didn’t buy), marketers can recommend the other product to me. This is known as content filtering. Or, marketers might recommend products to one customer based on a similar customer’s purchases – which is collaborative filtering. This has been around for quite a long time, but the difference we’re seeing now is that marketers are using data to make sure they personalize these recommendations even further. Using personalized marketing profiles, marketers can advertise things customers are more likely to purchase.
Another thing we’re seeing now that is relatively new is using geolocation data – the location of the customer – to promote sales. So let’s say I’m currently in Raleigh and there have been promos going around Raleigh. How will I hear about them? And how will marketers know I’m in Raleigh? If you give a company’s mobile app consent to see your location, then that company can do what we call proximity marketing.
Another active research field is customer retention. With today’s technology, I can open a new shop online – I don’t have to have a physical, brick-and-mortar shop. On one hand, this is a really good thing, right? But on the other hand, it increases the number of competitors. In this kind of environment, how can businesses stay ahead? How do they make sure they don’t lose customers? This is another important topic in marketing analytics.
Why should people care about marketing analytics? Why is it important?
Let’s consider the example I just shared – the number of shops opening now. Because you don’t have to have a physical store, it’s much easier to start a business these days – but this also means there are more competitors. But if you leverage marketing analytics, you’re always going to stay ahead of the competition.
Research shows that retailers and proximity marketers that use marketing analytics saw a lift in foot traffic of about 15%. Additionally, marketing analytics changes how businesses compete against other retailers selling the same product. Research shows that if you do marketing analytics correctly, you are going to get around 73% likelihood of purchase.
There are many instances of the positive power of marketing analytics. But, as is with any emerging science, there can be negative repercussions related to trial and error. So how can marketers leverage this evolving science carefully?
Whenever you are using data, you have to be very careful. Just because there’s a relationship between A and B doesn’t mean that A caused B. For example, let’s say you have a shop near a university. The university opened a new gym right beside your shop, and soon after, you also remodeled your shop. So now you have remodeling effects, plus the reality that more people are passing by because of the gym. So how do you know if it is because of the remodeling, or because of the gym, that new customers are coming into your shop? So this is where we have to be careful when you’re using the data. A happens and B happens at the same time – but that doesn’t mean that A caused B. We have to be careful with that.
Another thing is that you have to be very careful with the way you use personal data. You have to make sure that you are using it in the right way and retaining the trust of your customers. If your customer trusts you, he is probably not going to move to a new provider. Additionally, you want to give a good impression to that customer so that he can share with his friends – new potential customers. The good news is if we use data the right way, you won’t have to worry about losing customers. However, we also have to make sure from our end that we use models correctly. If we’re collecting data, that means collecting correct data. If we are sharing data, that means doing so with customer consent. Many industries are now giving incentives to customers for sharing their data – and most of the time, the customer will say yes, so long as it’s not extremely personal data.
As you leverage big data, use tools and engage in marketing analytics, you have to be careful and make sure that you are using data for the right purposes. Here are some helpful guidelines for making sure your customers are comfortable with the way you use their data. Number one: if you’re going to use data to inform your marketing strategy, you have to make sure that it’s data earned through explicit customer concept. It can’t be like, ‘Well, you signed something but you didn’t know you agreed to it.’ No, it has to be very, very clear. Number two: you have to give customers full control over the data they share. And three: make it easy for customers to change their privacy settings.
What advice do you have for individuals who are interested in a career in marketing analytics?
The good news is this is a career in high demand. If you go to the Bureau of Labor Statistics, you’ll see that they have this projection that by 2031, there will be an increase of about 19% in marketing analysts. Second, businesses and industries that started using marketing analytics early have stayed ahead of those that didn’t. So, if you want to go into the career, please do – with increasing demand for marketing analysts, this is the right time to join the field and gain experience.
Another piece of advice is that you should try to understand your role and know what it is that businesses want from marketing analysts. Try to understand all the things that will make you stand out from the crowd. Specifically, I recommend making sure that you understand how to use statistical software to get reports and write summaries and create dashboards. If you gain these skills, I believe the sky’s the limit. So if you’re moving into this career, don’t just get a certificate – make sure that you understand your role and try to polish your skills so you can stand out.
What kinds of problems can you solve with marketing analytics?
You can measure how an organization’s marketing activities are performing and how to improve them – and determine how your marketing activities compare to those of your competitors. What are your competitors doing that you’re not doing? Where are they spending their marketing dollars? Are you using all the channels that they’re using? Are they leveraging something that you’re not and therefore sitting ahead of you? Analytics helps you answer these questions and fill in the gaps.
Marketing analytics can also help you address more specific problems. Going back to the example of remodeling your shop – it’s important to make sure that you set up the correct hypothesis. Did remodeling really improve your revenue? To determine that, you need quite a bit of skill. These are the types of things we’re preparing our marketing analytics students for.
What kind of tools and technologies are firms currently using to collect, store and analyze customer data?
There are many tools you can use to collect data. Quite often, businesses use mobile apps to collect data from customers, because it’s easier. The easier you make it for them, the more likely they are going to do it. And make it short. Don’t try to ask them fifteen questions that each take two minutes. They’re not going to do that. Make it short and make sure it is directed toward what you are trying to do – that you are collecting the right metric.
In terms of storing data, many organizations are decentralizing their data and leveraging clouds like Google Cloud Storage. If something happens with their server, their data will still be perfectly intact. They’re also using Amazon Web Services (AWS). If businesses collect data for transactions, they can use Amazon DynamoDB and then push the final data into Amazon S3 buckets – another simple storage service. Some organizations still use centralized storage, storing data in hard disk drives and such, but the best way to store data now is through the cloud.
With data analysis, tools we’re seeing range from statistical tools all the way to online platforms – because industries are moving away from requiring heavy coding. You don’t have to do heavy coding now in order to do simple reports. All you need to do is click this and create a summary – and then you have your report. For data visualization, people are using tools like Tableau and Power BI. And in terms of analyzing the data, we use Python most of the time – as well as Power BI and R and SAS.
What we are seeing is that companies and individuals are trying to move away from tools that require you to code heavily – and toward tools that allow users to point and select. This is cool, because it means you don’t have to remember all the syntax. But if you do know how to code, you have an extra layer of advantage. With software like Tableau, most of the time it’s just point and click. But sometimes, you need to create KPIs that are not there in the data. So, how do you create them? You have to code. If you don’t know how to code, however, your hands are tied.
What are some examples of structured and unstructured data? What are some tools you can use to analyze these different types of data?
You can think of structured data as employee data in your organization – people’s names, social security numbers, phone numbers and so on. It’s more restrictive, which is a drawback, but it’s really structured and really nice – and it’s easier to analyze. From day one, you know what you want to do with it and what problem you want to solve.
An example of unstructured data is your email content – which may include video or audio. Typically, you have no idea how you’re going to use this data. You’re just keeping it in a data warehouse – and like the name suggests, you can take it out when you need it, move it to the right place, clean it up a little bit and then use it. So while you can keep whatever information you want there, you have to pay the price – there’s work you have to do before you analyze it.
Another example is if you have a customer relationship management (CRM) application. For customers opening an account, the company already knows what they want – and they’ll collect those few pieces of information. But if companies want to do data mining, most of the time they’re going to need unstructured data – such as customer feedback that includes photos, audio and plain text. This data is very rich in terms of what we can get out of it. It isn’t going to solve all of our problems, but it is going to help us.
Tools we use for structured data include SQLite, MySQL, OLAP. For unstructured data, we have tools like DynamoDB, MongoDB and Hadoop.
Are there any drawbacks to the analytics techniques being used today?
Yes, and here’s a simple example. Sometimes you get an advert for something you’ve never purchased and that you’re probably not going to buy for the rest of your life. How does that come into play?. Marketers are using techniques and algorithms to display that advert to you – but there’s some lack of understanding about the actual content of the analytical tools.
And like we discussed earlier, both structured data and unstructured data have their drawbacks. With unstructured data in particular, you have to be careful about the amount you put in the data bank. The more things you collect and store that are not correlated, the more work you have to do to analyze it and get something out of it. We can also overemphasize how helpful unstructured data is when the reality is that there are limitations of what you can do. When you are trying to understand customer behavior, you need as many parameters as possible – but nobody is going to define a set of parameters that will perfectly define an individual. So while we can use analytics, our hands are somewhat tied. We can only get so much information about our customers.
Where do you see opportunities for better analytics in the future?
Organizations are not leveraging technology as they should. Using more cloud services for storage and analytics, for example, is one area for growth. SAS Customer Intelligence 360 is one example. It allows organizations to do customer analytics, and it’s awesome. You don’t need to know how to do a bunch of stuff – all you need to understand is how to use the platform. We also know that AI is changing life. Through AI, we even have driverless cars. Why don’t we bring that technology to marketing? So, doing more machine learning and AI is another opportunity.
Another area of opportunity is text mining. Almost everybody understands how to analyze quantitative data. But how can they analyze tweets? How can they do sentiment analysis, determining whether a comment on social media is a genuine sentiment or a joke? Text mining is going to be really popular in the future.
And another thing is Natural Language Processing (NLP). If you want to book an appointment on the phone, most of the time you aren’t going to be talking to a real person, right? There are positives and negatives to this, but I want to stress the positive side. As humans, we can attach emotion to what somebody says. But think about it. Because NLP has no emotion, it doesn’t shun away customers – it tries to address their questions. So this is one place we can push the boundaries, and I think the future is bright.
What are some ethical considerations to keep in mind when using big data?
Make sure the customer understands how you use data and that you’re very clear about how their data is stored. That will give them a sense of relief. And make sure that you don’t breach that trust. Being careful and ethical about how you use data is a huge part of collecting good data.
Also, there are many new regulations coming into play now. For example, if I am an employee in your organization and for some reason I have to leave, I don’t have to leave my personal data with you – I have full control over it and can ask you to delete it instead of storing it to ensure it doesn’t fall into the wrong hands.
What is metadata and what value does it have?
Metadata is very important because employees come and leave. Let’s say Person A, Person B and Person C are responsible for determining how a company collects its data. In reality, these three individuals are not going to stay there forever – they’re either going to move up into managerial roles or change their place of work. So how do we make sure that the data is still usable?
What we normally do is try to attach metadata to each piece of data we’re collecting. Metadata gives a sense of when it is created, why it is created and how to properly use it. You also want to make sure you are following the regulations for that data. Metadata is really powerful, then. Without it, data will leave with these departing employees because organizations won’t know how to use it.
Are there any open source analytics tools for businesses or organizations with smaller budgets – and who may not have the coding expertise to use something like Python or R?
Great question. For small businesses, the license for popular open source tools can be costly. But if you’re just starting your business, you do want to make sure you use analytics.
Python and R do require a bit of coding, but what we are seeing now is that platforms are trying to provide tools that people with less coding experience can use – ones they can just point and click. They’re also collaborating more. So, if you know Python, but you don’t know R, you won’t have to study R in order to use it for your business – you can just type what you know in Python and bring it into R so that you can create what you want in R.
And if you’re trying to use predictive analytics, you can even use Excel. You don’t have sophisticated software. But the question is this: do you know what you want to do? If the answer is yes, you don’t have to use R or Python – you can use something as simple as Excel to write something that is really nice and that impacts your business.
What is the difference between statistics and marketing analytics?
Statistics is a way we summarize data to come up with meaningful information. In marketing analytics, however, you have a bunch of things you use in order to make a decision – and it’s much wider than using statistical tools. You have to make sure that you ask the right questions – and that requires a business mindset. The second thing that comes into play is what you use. In marketing analytics, you’re trying to determine what you need to solve your problem. Most of the time, what you need isn’t as simple as something you store in a database or an Excel file. Instead, you have to define what you need first. A simple example is customer retention. Normally, you don’t just have this information ready to go in a database – you have to know the right way to define it. That requires some understanding of marketing in order to define the good KPIs that go into a statistical summary.
Interested in a career in marketing analytics? Click here to learn more about the Master of Management, Marketing Analytics (MMA) program at NC State’s Poole College of Management.
- Categories: